Trending Assets
Top investors this month
Trending Assets
Top investors this month
Welcome Background Image
A new era of
smart money
Investing insights, verified.
Already have an account?
For You
All
Following
MACRO: Don’t Overreact to Geopolitical Headlines
Recent Middle East tensions are a reminder that geopolitical risk can flare up suddenly. And the headlines can be scary. But emotional, knee-jerk reactions aren’t the answer. Don’t overreact to geopolitical headlines.

See, geopolitical events are always a surprise. They’re inherently unknowable, so they’re never priced into the market.

That’s why stocks initially sell off on nasty geopolitical news. And it’s easy to overreact in the heat of the moment.

Emotional overreactions are a mistake. MAPsignals has your back with our unemotional, data-driven, geopolitical playbook.

Today, we’ll show you how to play the latest Middle East tensions and why our Big Money Index (BMI) agrees. Then we’ll identify the four sectors seeing the most Big Money buying in this volatile tape.


We know it’s easy to get faked out by geopolitical curveballs. That’s why we created an unemotional, data-driven geopolitical playbook you can use anytime bullets fly.

We analyzed 29 geopolitical events since 1940, ranging from wars to terrorist attacks to coups to pandemics. Here’s the upshot: timeframes matter!

What stocks do immediately after a geopolitical event doesn’t always tell you where they’ll be once the dust settles.

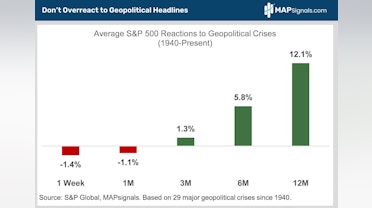
The S&P 500 has averaged 1.4% and 1.1% drops, respectively, a week and a month after geopolitical events. After Iran bombed Israel on April 13, the following week the index was down 3.1%.

But check out how it doesn’t pay to overreact. On average, the S&P 500 gains 1.3% three months after geopolitical events. Even better, the index chalks up 5.8% and 12.1% gains after six and 12 months, respectively, both of which are way above average:

The data shows how stocks tend to bounce back quickly. Now let’s dig deeper.

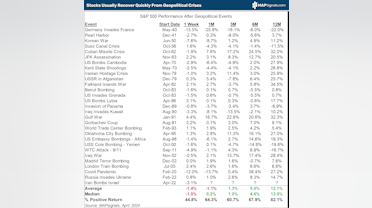
The table below details how the S&P 500 has reacted to every major geopolitical event since 1940.

It’s a great cheat sheet you can reference anytime geopolitical volatility strikes.

History’s verdict is crystal clear: geopolitical uncertainty consistently drives short-term market volatility, but stocks almost always bounce back quickly.

When bullets fly, don’t run for the hills. Instead, start prepping your buy list!


Are we getting the same market message from the BMI?

It has been a fantastic timing tool. Subscribers know we’ve been nailing market pivot points with it for years.

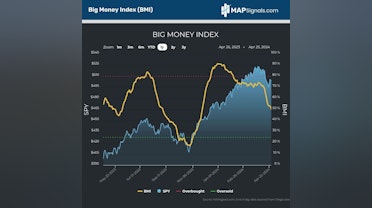
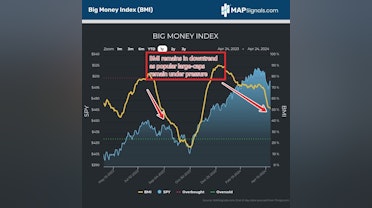
The BMI tracks institutional money flows. Readings under 25% are rare, indicating stocks are oversold and it’s time to buy. Conversely, readings over 80% mean stocks are overbought and traders should lighten up.

Let’s check out how helpful the BMI’s been since this bull market began in the fall of 2022.

Then it nailed the peak last July as it went to an overbought 84% and indicated a pullback was ahead.

Then the BMI threw off a huge buy signal last October when it slid to a super-low 17%. It was rightly telling you to buy as stocks were bottoming out. The S&P 500 then rocketed 28% through the end of March.

Let’s face it, the BMI has an amazing batting average!

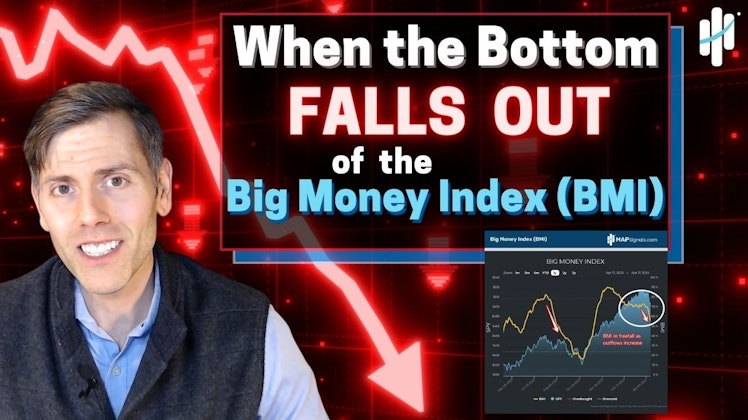
Here’s the latest: the BMI has swooned from 75% to 50%. A decline this steep, this fast is really rare. When the bottom falls out, it means buyers are on strike and sellers are taking over.

But don’t run for the hills. Instead, start prepping your buy list. Capitulation is likely around the corner.

Remember, we’re looking for contrarian buy signals from the BMI when it drops to 25%. That’ll be the green light that stocks are ready to bounce.
Trying times are buying times!


The key takeaway from both our geopolitical playbook and the BMI’s recent drop is to expect short-term volatility.

But don’t panic. This is likely a buying opportunity ahead of a big rebound.

If all you do is buy extreme weakness in the S&P 500 index, you’ll do well.

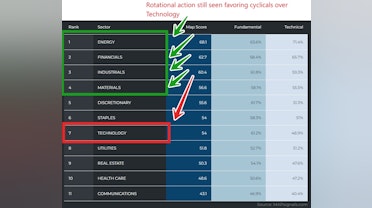
To do even better, focus on sectors seeing the most Big Money buying.


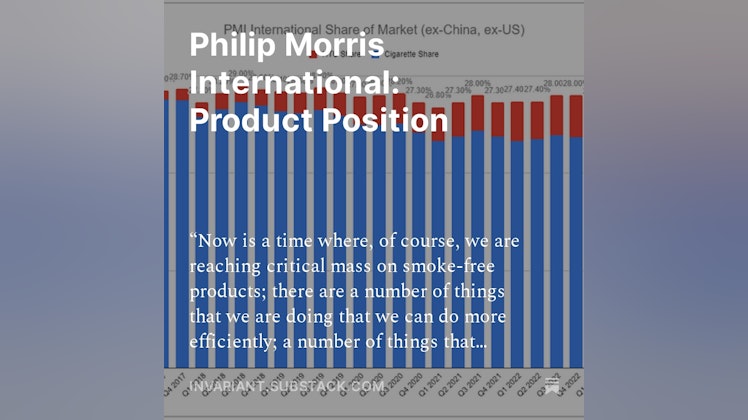
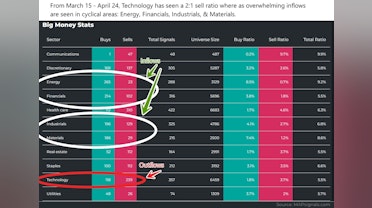
Market broadening is kicking into high gear as a strong economy and rising interest rates fuel a rotation out of technology and into cheaper, more cyclical sectors. Think energy, industrials, financials, and materials. It’s a safe bet these cyclicals will play a much bigger role in driving this bull market’s next leg higher. Check out our latest sector rankings to see how cyclicals have risen:


We know it’s easy to get faked out by geopolitical curveballs. That’s why we created an unemotional, data-driven geopolitical playbook you can use anytime bullets fly.

Since 1940, the S&P 500 has averaged 1.4% and 1.1% drops, respectively, a week and a month after major geopolitical events.

But don’t overreact to geopolitical headlines. Stocks tend to bounce back quickly.

On average, the S&P 500 gains 1.3% three months after geopolitical events. Even better, the index chalks up 5.8% and 12.1% gains after six and 12 months, respectively,

History’s message is clear. Geopolitical volatility is a buying opportunity.

The BMI agrees. It has collapsed at a rate rarely seen in the last 10 years. Whenever we’ve observed similar action, the next couple of weeks were volatile, with stocks in the red.

Don’t fret. A monster rally usually follows three months later. Prepare to buy the dip…and ride the rip.

If you want to find specific energy, industrials, materials, and financials stocks ramping with Big Money support, get started with a MAPsignals PRO subscription. It’ll get you access to our portal that updates every morning, showcasing the exact tickers getting bought and their scores.

As we’ve highlighted previously, brand new stocks are leading the next leg higher.

Our prized Top 20 list is full of market-beating equities in these new sectors.

There are plenty of winning cyclical stocks to buy on weakness as the market broadens out. If you’re a Registered Investment Advisor (RIA) or a serious investor, use a MAP to find them!

Invest well,
-Alec Young
post mediapost mediapost mediapost media
MAPsignals
Solutions - MAPsignals
MAPsignals’ volume and price analysis tools enable investors to identify unusually large trading activities around individual stocks and ETFs. This allows traders and investors to move beyond sentiment with a more precise, predictive, and measured data analysis tool that MAPs the signals being delivered by the market’s biggest players.MAPsignals capabilities include: Read more »

See more of what you want
Entering the Season of Volatility
The buyers’ strike continues.
After Friday’s equity dump, popular positions have been under pressure.
We believe the slide isn’t over. Money flows and history suggests we’re entering the season of volatility.

Last week was a reminder of how fast stocks can reprice. The S&P 500 dropped 3.04% and the tech-heavy NASDAQ 100 fell 5.36%.

While this healthy pullback came as a surprise to many folks, our data was again well-ahead of this move. When the bottom falls out of the Big Money Index, it’s alerting that there’s a lack of demand for equities.

After spending years on institutional trading desks, I learned to respect what the Big Money players are doing with their capital. Supply and demand is the ultimate power law for stocks.

When the bids fade, stocks flop…it’s that simple.

The good news is these pullbacks, while unexciting to sit through, eventually offer great deals on high-quality businesses once the buyers’ strike ends.

The less good news, depending on your perspective, is there’s a decent chance the current drawdown isn’t over.

As we’ll dive into, both our data and history indicate we’ll have to ride through more bumps before the market pumps.


Our data has been down-trending for months. Our North Star, the Big Money Index (BMI), has been falling from extreme overbought conditions since February.

A falling BMI indicates that institutional sponsorship (inflows) is drying up. As you can see, while the rate of decline for the BMI has moderated, it’s still breaking new lows:

Until the tides shift, I still have to keep a cautious stance.

When you dive below the surface, outflows have been seen in one of the hottest areas of the market: Technology.

Ultra-crowded positioning has come under attack.

If you recall, over a month ago, the Technology group in particular suddenly began to drop in rank. This is important for the health of major indices because the sector represents nearly 30% of the S&P 500…by far the largest allocation.


Those areas are still thriving as seen in our sector ranks. This has come at the expense of Technology falling into 7th place:

And this data very much jives with the money flows we’re witnessing. When you study single stock buys and sells since March 15th, Technology has suffered 2:1 outflows.

We see this money rotating into select Energy, Financials, Industrials, and Materials as shown below from our portal:

Data really is beautiful! These powerful clues reveal why following money flows often alerts investors to potential volatility ahead.

I firmly believe we aren’t out of the woods yet for markets. I can see us retesting Friday’s lows…and even experiencing a small bout of capitulation.

There are 2 reasons for this idea. First, inflows into smaller cyclical areas are no match for outflows in mega-cap technology stalwarts.

When the latter comes under pressure, expect indices to remain anchored.

Secondly, history suggests we’re entering the season of volatility.


It’s one thing to have cold hard data guide your trading. It’s another to have those same insights dovetail with hard-hitting historical evidence.

As we showed last week, a free-falling BMI tends to spell trouble for stocks over the near-term. That message didn’t disappoint with Friday experiencing one of the largest pullbacks we’ve witnessed in 2024.

Turns out there’s another reason to expect more near-term bobbing and weaving. Going back to 1998, April 19th – May 19th sees large- and small-caps return lackluster performance.

In this seasonally weak period, the S&P 500 is flat while the S&P Small Cap 600 gains a modest .07%.

But don’t zip your bear suit too tight. Beginning May 20th, seasonal strength kicks into high gear through July with the S&P 500 ramping 1.74% and small-caps flying 2.52%.

The remainder of the year also sees further average gains:

Based on the last 26 years, we’re entering the season of volatility. And this echoes the same message found in our money flow data.

It’s not surprising that the Big Money has already jumped ahead and started selling stocks in front of this historically weak period.

But the important message, that we drive home year after year, is you want to be preparing an all-star buy list.

These selloff events offer outstanding deals on incredible companies at value prices. That’s the playbook we’re gearing up for with our subscribers.

It’s simple.

Near-term, embrace the dip.

Then ride the rip!

A beautiful buy the dip situation is unfolding.

Let’s wrap up.

Here’s the bottom line: Markets are not out of the woods yet. Money is rotating out of big tech and into cyclical areas like Energy, Financials, and Industrials.

But those inflows are no match for outflows in mega-cap giants.

For that reason, expect an anchor on major indices until the selling slows.

Add to it that history proves how stocks tend to show lackluster performance from April 19th – May 19th.

This tells us to ride out the dip…but also prepare for a coming rip!
Let data light the path.

Follow the Big Money!

If you’re a serious investor or Registered Investment Advisor (RIA) looking for state-of-the-art research to add to your arsenal, get started with a MAP PRO subscription.

Opportunities like this rarely come along.

Let a market map lead the way!
post mediapost mediapost mediapost media
MAPsignals
Solutions - MAPsignals
MAPsignals’ volume and price analysis tools enable investors to identify unusually large trading activities around individual stocks and ETFs. This allows traders and investors to move beyond sentiment with a more precise, predictive, and measured data analysis tool that MAPs the signals being delivered by the market’s biggest players.MAPsignals capabilities include: Read more »

WHEN THE BOTTOM FALLS OUT OF THE BIG MONEY INDEX | S&P 500 Analysis
In this video, we show why a free-falling Big Money Index (BMI) spells trouble for stocks over the near-term. The S&P 500 struggles in the coming weeks. But don't get too bearish because this will prove to be a great dip to buy.

post media
YouTube
WHEN THE BOTTOM FALLS OUT OF THE BIG MONEY INDEX, LOOK OUT BELOW | S&P 500 Analysis
#Pullback #Stocks #LucasDowney When the bottom falls out of the Big Money Index, a huge opportunity is around the corner: https://mapsignals.com/map-blog/whe...

The story of FNAF
I was told about this site by a friend, and when I found your writing, I was very impressed. I'll come back often now that I've saved it fnaf

How the S&P 500 Typically Reacts to Geopolitical Crises | BNN Bloomberg
Alec Young, our chief investment strategist, joins BNN Bloomberg to talk about why investors shouldn’t overreact to spooky geopolitical headlines.

YouTube
How the S&P 500 typically reacts to geopolitical crises
Alec Young, chief investment strategist at MapSignals, joins BNN Bloomberg to talk about why investors shouldn't overreact to spooky geopolitical headlines.S...

24/7 stocks?
The NYSE is exploring 24/7 trading. What do you think about this?

I used to think this was a good idea because if crypto can do it, why not everyone? But now I am more neutral on the idea. There’s something to be said for the “rest” and “healing process” of the market being closed for a certain amount of hours everyday.

Fear and greed can get exacerbated if there isn’t a natural moment to step back and reflect.

What are the benefits of 24 hour trading? Immediate gratification? What else? Are there investment strategies one could employ with 24 hour trading that they can’t do now?
+ 1 comment
Most bought
Most sold
More
Investing
Follower $
Rank
Name
1W change
Commonstock is a social network that amplifies the knowledge of the best investors, verified by actual track records for signal over noise. Community members can link their existing brokerage accounts and share their real time portfolio, performance and trades (by percent only, dollar amounts never shared). Commonstock is not a brokerage, but a social layer on top of existing brokerages helping to create more engaged and informed investors.
Already have an account?