Trending Assets
Top investors this month
Trending Assets
Top investors this month
Welcome Background Image
A new era of
smart money
Investing insights, verified.
Already have an account?
For You
All
Following
$AREC - Rare Earth Opportunity (US / Africa Connection)
I have been searching for some rare earth plays as I believe the US will fall on some hard times and things get worse with China and the US. Especially if we get a Trump administration for the next four years. https://www.bbc.com/news/world-68896707


In piecing all of this together one company is starting to stand out and come into focus for me. American Resources $AREC and its ReElement Subsidiary Company. They have put there American pawns in play combined with there African relationships in place. They have received cheap bonds from governments so they are bought into what there trying to achieve. They have faculties up and running. They have done all the prep work and I believe they know its coming. One thing I do know, is that once the wave hits the shore; they will be ready and it will be too late. So at these low prices, I am starting to take positions now. Cus once; the waves hits the shore; the water is going to rise fast.

Here is a list of milestones and announcement to consider incorporating. These milestones also present $AREC with a number of new and exciting opportunities as the supply chain sees what we are accomplishing.

ReElement Technologies Brings Rare Earth Element and Lithium Production Back to the United States with Receipt of Certificate of Occupancy for Marion, Indiana Supersite
ReElement Technologies Expands Its Exclusive Rights for Rare Earth Element Purification Technology to Include All Feedstocks
American Resources Corporation's American Carbon Corporation Receives Additional $1,055,780 in Environmental Bond Releases
ReElement Technologies Announces Successful Execution and Closing of Bond Purchase Agreement for $150 Million of Kentucky Industrial Building Revenue Bonds for its Kentucky Lithium Refinery
American Resources Corporation's American Carbon Corporation Provides Updated Rare Earth Analysis From West Virginia Project
American Resources Corporation's American Carbon Corporation Completes Strategic Acquisition of 51% Interest in Iron Ore and Titanium Assets
ReElement Technologies Partners with Domestic Auto Manufacturer To Establish Circular Economy for Rare Earth Magnets
ReElement Technologies Joins Forces With EDP Renewables to Pioneer Sustainable Rare Earth Magnet Recycling
ReElement Technologies Corporation Enters Into Purified Rare Earth Oxide Sales Agreement
ReElement Technologies Adds Former United States Ambassador Mark Gilbert and Former CIA Senior Executive Kevin Higgins to Board of Directors
Yahoo Finance
American Resources Corporation’s ReElement Technologies Forms ReElement Technologies Africa Ltd
ReElement Africa will be the parent company of local entities held throughout countries of AfricaReElement Africa provides the flexibility for financing and ownership structures at the local levelFISHERS, IN / ACCESSWIRE / December 4, 2023 / American ...

See more of what you want
Major Ultra-Bullish Signal is Approaching
Plenty of growth stocks are feeling the pain.
That’s what happens when institutional demand grinds to a halt.
Don’t fret. One rare setup just fired, indicating a major ultra-bullish signal is approaching.

The rips and dips keep coming for equities. The Fed presser from yesterday offered little confidence for investors. We’ll let other research shops recap that narrative.

At MAPsignals, we’re going to focus on what we do best: Money Flows.

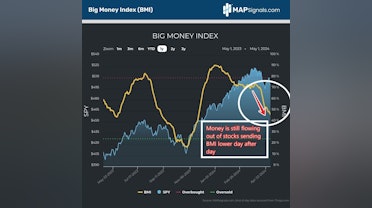
Our market North Star, the Big Money Index (BMI), has been in free-fall for weeks…even dropping further after yesterday’s intraday pump and slump.

But there’s good news. A monster bullish setup is forming in our data. If history is any guide, we are looking at a crowd-stunning rally coming later this year.

Now is not the time to get fearful. It’s time to get cheerful.


The all-clear signal is not here yet.

That’s evidenced by the Big Money Index sinking day after day.

As highlighted last week, seasonal volatility is causing overall weakness and rotational action. Inflows are seen in more cyclical areas like Energy, Financials, and Industrials as money is fleeing Big Tech.

Given Tech’s huge market weight in the S&P 500, those outflows are why major large-cap indices are anchored.

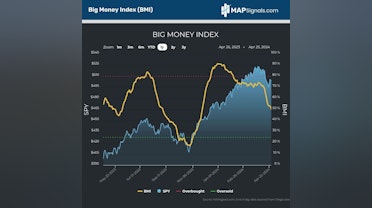
Below shows how the BMI continues to spiral, last hitting a YTD low of 47.2%:

And while I’ve been pointing to overall weakness in our data since February, today’s data-driven environment is actually quite rare.

Our BMI has been trending lower since December 29th. That’s a long period… one that suggests a major ultra-bullish signal is approaching.


Last week we took a deep dive in our data and found something interesting. When the BMI falls 40+ points in 16 weeks, it’s extraordinary.

In fact, over the past 30 years, it’s occurred 303 times.

While that may not seem exceptional on the surface, in reality most of those instances cluster around 17 discrete episodes throughout the 3 decade period including back-tested data.

But history proves these prolonged money flow dips are quite bullish over the medium to long-term. Even more striking are periods that are very similar to today’s environment.

I’m referring to conditions when the BMI fell 40+ points from a red-hot overbought reading over the next 4-month trading period.

Let’s visualize one from recent memory.

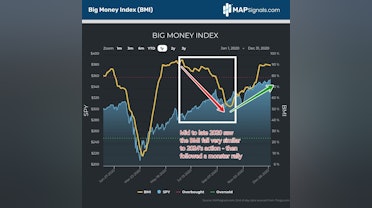
We experienced a similar peak to drop like now after the pandemic. From mid to late 2020, the BMI dropped from the 90 area to the low 50s, eerily similar to today.

By far this is the closest analog to today’s situation:

  • Investors were still spooked by the unprecedented macro environment
  • Bearish rhetoric was all over the media given the unfolding pandemic

That pullback eventually ended with a powerful rally starting soon later:

What’s important to note is that market lows were eventually hit and the BMI began rallying well ahead of the surge that followed.

Turns out, this similar pattern has been rather predictable in our data.

If you’re allergic to an extremely bullish setup, LOOK AWAY NOW.

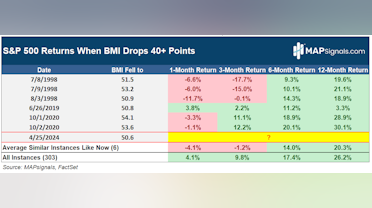
When we single out similar BMI pullbacks to now, we find 6 instances ranging from 1998, 2019, & 2020.

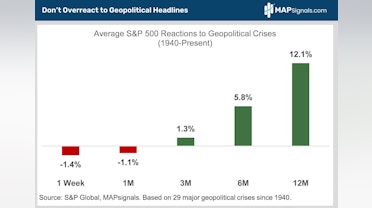
What we find is near-term stocks struggle with the S&P 500 falling 4.1% a month later and 1.2% 3-months later.

But the underlying message that you need to heed is stocks zoom 6 and 12 months later with average gains of 14% and 20.3% respectively.

If that doesn’t impress you, I’ve included all 303 instances as well. In aggregate, they forecast market beating forward returns:

But I don’t want to stop with the coming bullish message.

For those that think Technology stocks are not going to shine again…keep dreaming.

This massive BMI drop favors those bold enough to bet on high-quality growth stocks.

Here I’ve performed the same analysis but with the NASDAQ 100 ($NDX). The same weakness is seen 1 to 3 months out, with -2.5% and -.2% returns respectively.

But that’s when you want to be accumulating best of breed stocks. 6-months later the $NDX surges 31.6% and 12-months later an awe-inspiring 49.5% jolt is seen.

And for those curious, the 303 instances offer outstanding forward gains too:

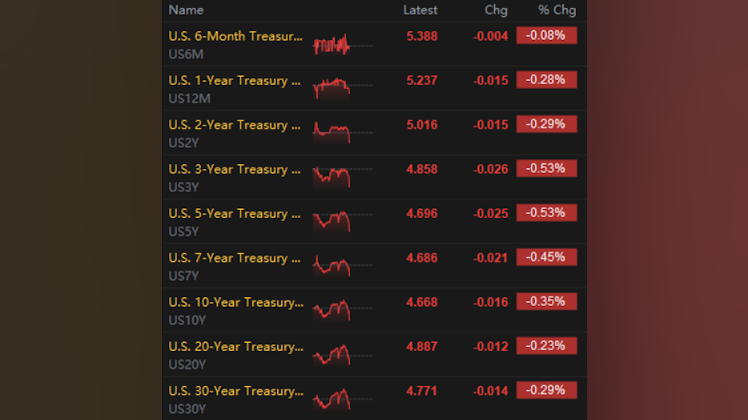
Folks, stop worrying about interest rates. You might risk missing a major ultra-bullish situation.
Instead, follow evidence-based data.

New market leaders are under heavy accumulation…now isn’t the time to bounce, it’s the time to pounce.

We are getting our subscribers ready for when the all-clear signal finally strikes. I firmly believe it’s around the corner.

Just like we sent out some of the best stocks to buy in October, we’re prepping for a similar rip.
A market map is the way.

Here’s the bottom line: Investors are looking for clarity in this turbulent market. Data has more answers than the news ever will.

We are currently witnessing a rare 40+ point drop in the Big Money Index (BMI). History says a little more pain will lead to monster gains in the coming months.

Not only that, whenever the BMI drops 40+ points from a red-hot overbought period similar to now, stocks have never been lower a year later, with the NASDAQ averaging a 49.5% twelve-month gain.

Don’t stop and stare. PREPARE!

After doing this study, earlier this week we sent 3 stocks to our PRO Members that we love for this coming uptrend. And chances are they aren’t names you’re familiar with…but the Big Money loves them!

Listen, a major ultra-bullish signal is approaching.

Don’t wait for the media bull whistle to blow…it’ll be too late.

Follow the money and you’ll be ahead of the move.

Have a great week!

If you’re a money manager, investment advisor, or someone that is serious about investing, now is a wonderful time to get started with a MAPsignals PRO subscription.

Good things are coming!
post mediapost mediapost mediapost media
MAPsignals
Solutions - MAPsignals
MAPsignals’ volume and price analysis tools enable investors to identify unusually large trading activities around individual stocks and ETFs. This allows traders and investors to move beyond sentiment with a more precise, predictive, and measured data analysis tool that MAPs the signals being delivered by the market’s biggest players.MAPsignals capabilities include: Read more »

"Our Industry Does Not Respect Tradition"
As discussed in Monday’s update, Mr. Market reacted to Meta’s rising AI investments / capital expenditures (CapEx) with some uneasiness. Microsoft is working through similar developments, with FY24e CapEx likely to exceed $50 billion – nearly 3x higher than its FY19 spend. But the market responded more optimistically to the Microsoft news, with the stock climbing a few points following the Q3 FY24 results. In my view, that reaction reflected a clearer understanding from investors on the opportunities that Microsoft is pursuing, along with their strong starting hand (seeing the path to an attractive ROI).

With that said, this period isn’t without risk for Microsoft. As CEO Satya Nadella noted in a recent keynote, they are going all-in on AI: “We’ve taken this platform shift and etched it into every layer of our tech stack… People ask, ‘What’s the AI product?’ The answer is everything; the infrastructure, the data layer, the tools, everything.” We are in the early innings of this platform shift, with the winners and the losers to be determined in due time. For now, as you can see in the graphs below, shareholders are being asked to accept significant investment risk. When we look back in five or ten years, Microsoft’s results will have been greatly impacted by the output from this CapEx ramp.

thescienceofhitting.com
"Our Industry Does Not Respect Tradition"
An update on Microsoft

Will Bulls Bounce Back or is This a Bearish Breakdown? #
ADA took a tumble! After dropping from a high of $0.68, the charts are flashing mixed signals. Will the bulls find support at $0.45 or are we looking at a bearish breakdown? Read the full analysis here

Coinpedia Fintech News
Cardano Price Prediction: 2023, 2024, 2025, 2026 - 2030
Cardano ADA price 2023 - 2025 based on deals analysis and statistic. In depth view into ADA Price, analyst predictions until 2030.

The ADP employment report showed an increase of 192,000 in US employment in April, above the 180,000 expected. The service sector added 145,000 jobs, and the goods sector added 47,000 jobs. The leisure and hospitality sector saw the largest addition, with 56,000 jobs added. The report also showed sticky annual pay growth, particularly for job changers, up 9.3% Yoy which is down from 10.0% YoY in Mar but still up from 7.3% YoY in Feb.

The market is fading the ADP data which showed better-than-expected employment growth and sticky wage growth. Treasury yields are down early on FOMC day. S&P and Nasdaw futures bounced off of morning lows.
post media

The ECI grew 1.2% quarter-over-quarter (QoQ) and 4.2% year-over-year (YoY) in Q1 2024, exceeding expectations and matching the previous quarter's growth rate. Private wages and salaries increased 1.1% QoQ and 4.3% YoY, unchanged from the previous quarter. The growth in private wages was broad-based across occupations, with sales experiencing a notable 1.9% QoQ increase. Notably, wages and salaries of state and local governments grew 1.4% QoQ and 5.0% YoY, driven by healthcare services and public administration jobs.

The market responded to the ECI release with yields spiking, and small-cap stocks ($IWM) declining due to the continued pressure of high wages on businesses. The ECI beat was considered significant, especially given the FOMC meeting, and may have continue to put pressure on the Fed to remain hawkish.

MACRO: Don’t Overreact to Geopolitical Headlines
Recent Middle East tensions are a reminder that geopolitical risk can flare up suddenly. And the headlines can be scary. But emotional, knee-jerk reactions aren’t the answer. Don’t overreact to geopolitical headlines.

See, geopolitical events are always a surprise. They’re inherently unknowable, so they’re never priced into the market.

That’s why stocks initially sell off on nasty geopolitical news. And it’s easy to overreact in the heat of the moment.

Emotional overreactions are a mistake. MAPsignals has your back with our unemotional, data-driven, geopolitical playbook.

Today, we’ll show you how to play the latest Middle East tensions and why our Big Money Index (BMI) agrees. Then we’ll identify the four sectors seeing the most Big Money buying in this volatile tape.


We know it’s easy to get faked out by geopolitical curveballs. That’s why we created an unemotional, data-driven geopolitical playbook you can use anytime bullets fly.

We analyzed 29 geopolitical events since 1940, ranging from wars to terrorist attacks to coups to pandemics. Here’s the upshot: timeframes matter!

What stocks do immediately after a geopolitical event doesn’t always tell you where they’ll be once the dust settles.

The S&P 500 has averaged 1.4% and 1.1% drops, respectively, a week and a month after geopolitical events. After Iran bombed Israel on April 13, the following week the index was down 3.1%.

But check out how it doesn’t pay to overreact. On average, the S&P 500 gains 1.3% three months after geopolitical events. Even better, the index chalks up 5.8% and 12.1% gains after six and 12 months, respectively, both of which are way above average:

The data shows how stocks tend to bounce back quickly. Now let’s dig deeper.

The table below details how the S&P 500 has reacted to every major geopolitical event since 1940.

It’s a great cheat sheet you can reference anytime geopolitical volatility strikes.

History’s verdict is crystal clear: geopolitical uncertainty consistently drives short-term market volatility, but stocks almost always bounce back quickly.

When bullets fly, don’t run for the hills. Instead, start prepping your buy list!


Are we getting the same market message from the BMI?

It has been a fantastic timing tool. Subscribers know we’ve been nailing market pivot points with it for years.

The BMI tracks institutional money flows. Readings under 25% are rare, indicating stocks are oversold and it’s time to buy. Conversely, readings over 80% mean stocks are overbought and traders should lighten up.

Let’s check out how helpful the BMI’s been since this bull market began in the fall of 2022.

Then it nailed the peak last July as it went to an overbought 84% and indicated a pullback was ahead.

Then the BMI threw off a huge buy signal last October when it slid to a super-low 17%. It was rightly telling you to buy as stocks were bottoming out. The S&P 500 then rocketed 28% through the end of March.

Let’s face it, the BMI has an amazing batting average!

Here’s the latest: the BMI has swooned from 75% to 50%. A decline this steep, this fast is really rare. When the bottom falls out, it means buyers are on strike and sellers are taking over.

But don’t run for the hills. Instead, start prepping your buy list. Capitulation is likely around the corner.

Remember, we’re looking for contrarian buy signals from the BMI when it drops to 25%. That’ll be the green light that stocks are ready to bounce.
Trying times are buying times!


The key takeaway from both our geopolitical playbook and the BMI’s recent drop is to expect short-term volatility.

But don’t panic. This is likely a buying opportunity ahead of a big rebound.

If all you do is buy extreme weakness in the S&P 500 index, you’ll do well.

To do even better, focus on sectors seeing the most Big Money buying.


Market broadening is kicking into high gear as a strong economy and rising interest rates fuel a rotation out of technology and into cheaper, more cyclical sectors. Think energy, industrials, financials, and materials. It’s a safe bet these cyclicals will play a much bigger role in driving this bull market’s next leg higher. Check out our latest sector rankings to see how cyclicals have risen:


We know it’s easy to get faked out by geopolitical curveballs. That’s why we created an unemotional, data-driven geopolitical playbook you can use anytime bullets fly.

Since 1940, the S&P 500 has averaged 1.4% and 1.1% drops, respectively, a week and a month after major geopolitical events.

But don’t overreact to geopolitical headlines. Stocks tend to bounce back quickly.

On average, the S&P 500 gains 1.3% three months after geopolitical events. Even better, the index chalks up 5.8% and 12.1% gains after six and 12 months, respectively,

History’s message is clear. Geopolitical volatility is a buying opportunity.

The BMI agrees. It has collapsed at a rate rarely seen in the last 10 years. Whenever we’ve observed similar action, the next couple of weeks were volatile, with stocks in the red.

Don’t fret. A monster rally usually follows three months later. Prepare to buy the dip…and ride the rip.

If you want to find specific energy, industrials, materials, and financials stocks ramping with Big Money support, get started with a MAPsignals PRO subscription. It’ll get you access to our portal that updates every morning, showcasing the exact tickers getting bought and their scores.

As we’ve highlighted previously, brand new stocks are leading the next leg higher.

Our prized Top 20 list is full of market-beating equities in these new sectors.

There are plenty of winning cyclical stocks to buy on weakness as the market broadens out. If you’re a Registered Investment Advisor (RIA) or a serious investor, use a MAP to find them!

Invest well,
-Alec Young
post mediapost mediapost mediapost media
MAPsignals
Solutions - MAPsignals
MAPsignals’ volume and price analysis tools enable investors to identify unusually large trading activities around individual stocks and ETFs. This allows traders and investors to move beyond sentiment with a more precise, predictive, and measured data analysis tool that MAPs the signals being delivered by the market’s biggest players.MAPsignals capabilities include: Read more »

Most bought
Most sold
More
Investing
Follower $
Rank
Name
1W change
Commonstock is a social network that amplifies the knowledge of the best investors, verified by actual track records for signal over noise. Community members can link their existing brokerage accounts and share their real time portfolio, performance and trades (by percent only, dollar amounts never shared). Commonstock is not a brokerage, but a social layer on top of existing brokerages helping to create more engaged and informed investors.
Already have an account?