Fear is swirling.
Equities are under pressure.
When the bottom falls out of the Big Money Index, a huge opportunity is around the corner.
Wow. What a difference a week makes. We’re finally witnessing a pullback that most thought was impossible. The overarching bullish sentiment seemed to never stop.
That is, until recently. A cocktail of investor worries are weighing on stocks:
- Interest rates are surging. The 10Y yield broke above 4.60%, a level last seen in November
- Geopolitical uncertainty is increasing with Middle East attacks
- And the threat of rates remaining higher for longer has traders betting that interest rate cuts will get delayed, possibly into 2025
While I could opine on each of these macro worries, today we’ll focus on MAPsignals bread and butter: Money flows.
Right now, there’s a dramatic shift in our data. In fact, we’re observing a rare BMI dump that’s only occurred a few times in recent history.
When investors stop buying stocks, there’s nowhere for prices to go but lower.
Today, we’re going to size up the new data landscape, then we’ll look to history for clues on what’s ahead.
Expect a dip before a monster rip.
It’s always good to rewind the tape. Nearly 6 weeks ago, I noted how our trusty market gauge, the Big Money Index (BMI) was declining.
But as we’ve learned time and time again, supply and demand ultimately determines market direction.
When money is flowing into stocks, they rise. When money comes out, they drop.
A falling BMI is our canary in the coal mine, alerting us that all is not well under the surface of the market.
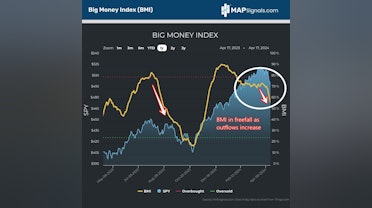
While the BMI can be early and delayed, it won’t be denied. This past week saw one of the largest drops in the BMI ever:
Over the past 4 trading days, the BMI fell from 69% to 57.1% this morning. That’s a monumental collapse of 11.9%.
When the bottom falls out of the Big Money Index, it can only mean that buyers have gone on strike and sellers are taking over.
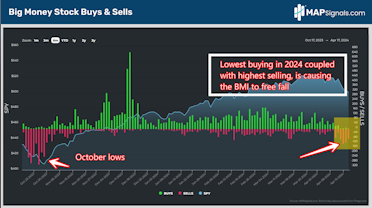
Below reveals this beautifully. The last few days reveal the least amount of buying in 2024. Also to note is we’re witnessing the most selling since October:
While the selloff is well underway and a lot of destruction has already taken place, it’s important to note where the outflows are occurring.
Interest rate sensitive groups like Real Estate, Biotech, and Clean Energy are the pain points. As global rates surge, these capital-intensive groups have suffered.
Does that mean the coast is clear? NO
As I
mentioned to our members on Monday, we have yet to see leadership quality stocks get sold. In other words, this selloff is lacking one element to give us a strong “buy the dip” signal: Capitulation.
Capitulation is broad-based selling that hits all areas…even the great stocks. Those golden hour moments typically create an excellent time to shop for value opportunities.
Based on history, we are likely to see a bit more downside before a monster rally.
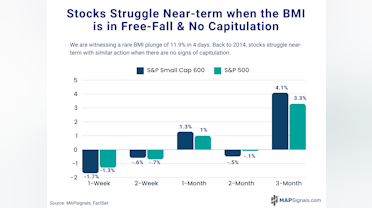
Check this out. Going back to 2014, I isolated all similar free-falling BMI periods that did not see capitulation. I found 15 discrete instances.
In the following 2-weeks, negative average returns were seen in both large and small-cap stocks.
Notably, the S&P 500 and S&P Small Cap 600 each fell 1.3% and 1.7% respectively the following week, indicating capitulation should come soon.
That’s the bad news.
The great news is these quick dips often offer a window of opportunity for the prepared. Three months later the S&P 500 jumps 3.3% and even better small-caps climb 4.1%:
This is why having reliable data is paramount in these trying times.
When the bottom falls out of the Big Money Index, don’t run for the hills. Instead, start prepping your buy list.
Capitulation is likely around the corner. That’ll be the green light that stocks are ready to bounce.
Trying times are buying times.
Let’s wrap up.
Here’s the bottom line: Markets are in a downtrend. Our Big Money Index has collapsed at a rate rarely seen in the last 10 years.
Whenever we’ve observed similar action, the next 2-weeks are volatile with both large and small-caps in red.
But don’t fret. A monster rally follows 2-months later.
We’re preparing to buy the dip… and ride the rip.
That’s the message we’re telling our members…a recipe that has worked countless times in the past.
We’re waiting for the capitulation signal to fire. Then we’ll go shopping for outlier stocks on sale.
That’s how you win.
These windows of opportunity rarely come along.
You just need a MAP to guide you.